The U.S. Increases LNG Exports

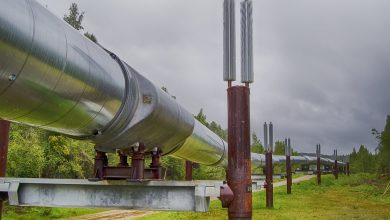
Liquefied natural gas (LNG) is natural gas that has been cooled to -260 degrees Fahrenheit, bringing it to a liquid for better shipping and storage. Natural gas goes through a liquefaction and purification process at LNG plants. These are host to generally one or more “trains” that convert the natural gas into the odorless, compact liquid. The world is increasingly dependant on this type of energy fuel, therefore transporting it far distances is a necessity. LNG takes up 600 times less space than natural gas, making it easier to transport to meet demands where pipelines cannot reach.
Specially-designed tankers, shown below, or trucks carry LNG from the export terminal to the import terminal, where it is returned to its original state as natural gas. From the end-point terminal, natural gas is fed through pipelines and into homes, factories, etc.
 Photo from Mitsui O.S.K. Lines
Imports
The United States has moved away from importing LNG, as it continues to successfully find more and more domestic natural gas. In 2018, the U.S. imported the lowest percentage of natural gas since 1997. Of the 76.5 billion cubic feet of LNG imported in 2018, the U.S. received 65.8 billion cubic feet from Trinidad and Tobago.
These imports are most often used in New England, where there are “significant pipeline constraints when heating demand increases substantially during periods of very cold weather” (Energy Information Administration).
 Photo from U.S. Department of Energy’s LNG monthly report
As of September 2019, there are five import terminals. Current data reflects four located in Everett, Massachusetts, Cove Point, Maryland, Elba Island, Georgia, and Freeport, Texas. Everett bypassed the other terminals in the billions of cubic feet each month in 2018 — except in December when Cove Point imported 6.2 billion cubic feet compared to Everett’s 5.6 billion cubic feet. The most received in one month was 10.8 billion cubic feet in Everett in January 2018. Freeport, Texas only imported LNG one time. It was a comparatively minimal volume of 0.4 billion cubic feet in September 2018.
Exports
Conversely, exports reached a record high of 1,083 billion cubic feet to 37 countries from the United States. The top five countries to receive natural gas in the form of LNG were South Korea (23 percent), Mexico (17 percent), Japan (12 percent), China (8 percent), and India (5 percent). The United States exported 0.6 billion cubic feet of LNG by truck in 2018, with 97 percent of that total going to Mexico.
Domestically, there are several new projects and expansions meant to increase capacity at LNG export terminals. The United States is looking to add 46 new natural gas pipelines, which is expected to increase LNG exports in the Gulf Coast (David, 2019). The Energy Information Administration estimates — with these projects and the addition of an export terminal in Texas — that the United States will quickly catch up to the top LNG exporters, Australia and Qatar, and nestle in as the third-largest exporter.
There are six LNG export terminals in the United States: Sabre Pass, Louisiana, Cove Point, Maryland, Corpus Christi, Texas, Cameron, Louisiana, Elba Island, Georgia, and Freeport Texas. The Department of Energy recently approved four more terminals for new construction, though the proposed projects are not ready to roll out. In 2019, several of the existing terminals will either be fully functional or expanded to account for more liquefaction trains. The terminals in Cameron and Freeport are newly commissioned with two to three liquefaction facilities in each location. New construction in Elba Island is expected to be completed in 2019. It will host 10 smaller liquefaction facilities, which will hold at least 0.33 billion cubic feet of LNG.
By 2021, these projects are expected to produce an export capacity of 10 billion cubic feet of LNG per day for the United States.
Sources
Ken Silverstein (2019). “As American Coal Fades, Will LNG Exports Pick Up Market Share?” Forbes.
Bradley David (2019. “Mexico, LNG Projects Fed by Up to 17 Bcf/d of New U.S. Pipeline Capacity This Year, Says EIA” Natural Gas Intelligence
Robin Webster (2013). “What’s the difference between natural gas, liquid natural gas, shale gas, shale oil and methane? An oil and gas glossary.” Carbon Brief.
Energy Information Administration (2018). “U.S. liquefied natural gas export capacity to more than double by the end of 2019”